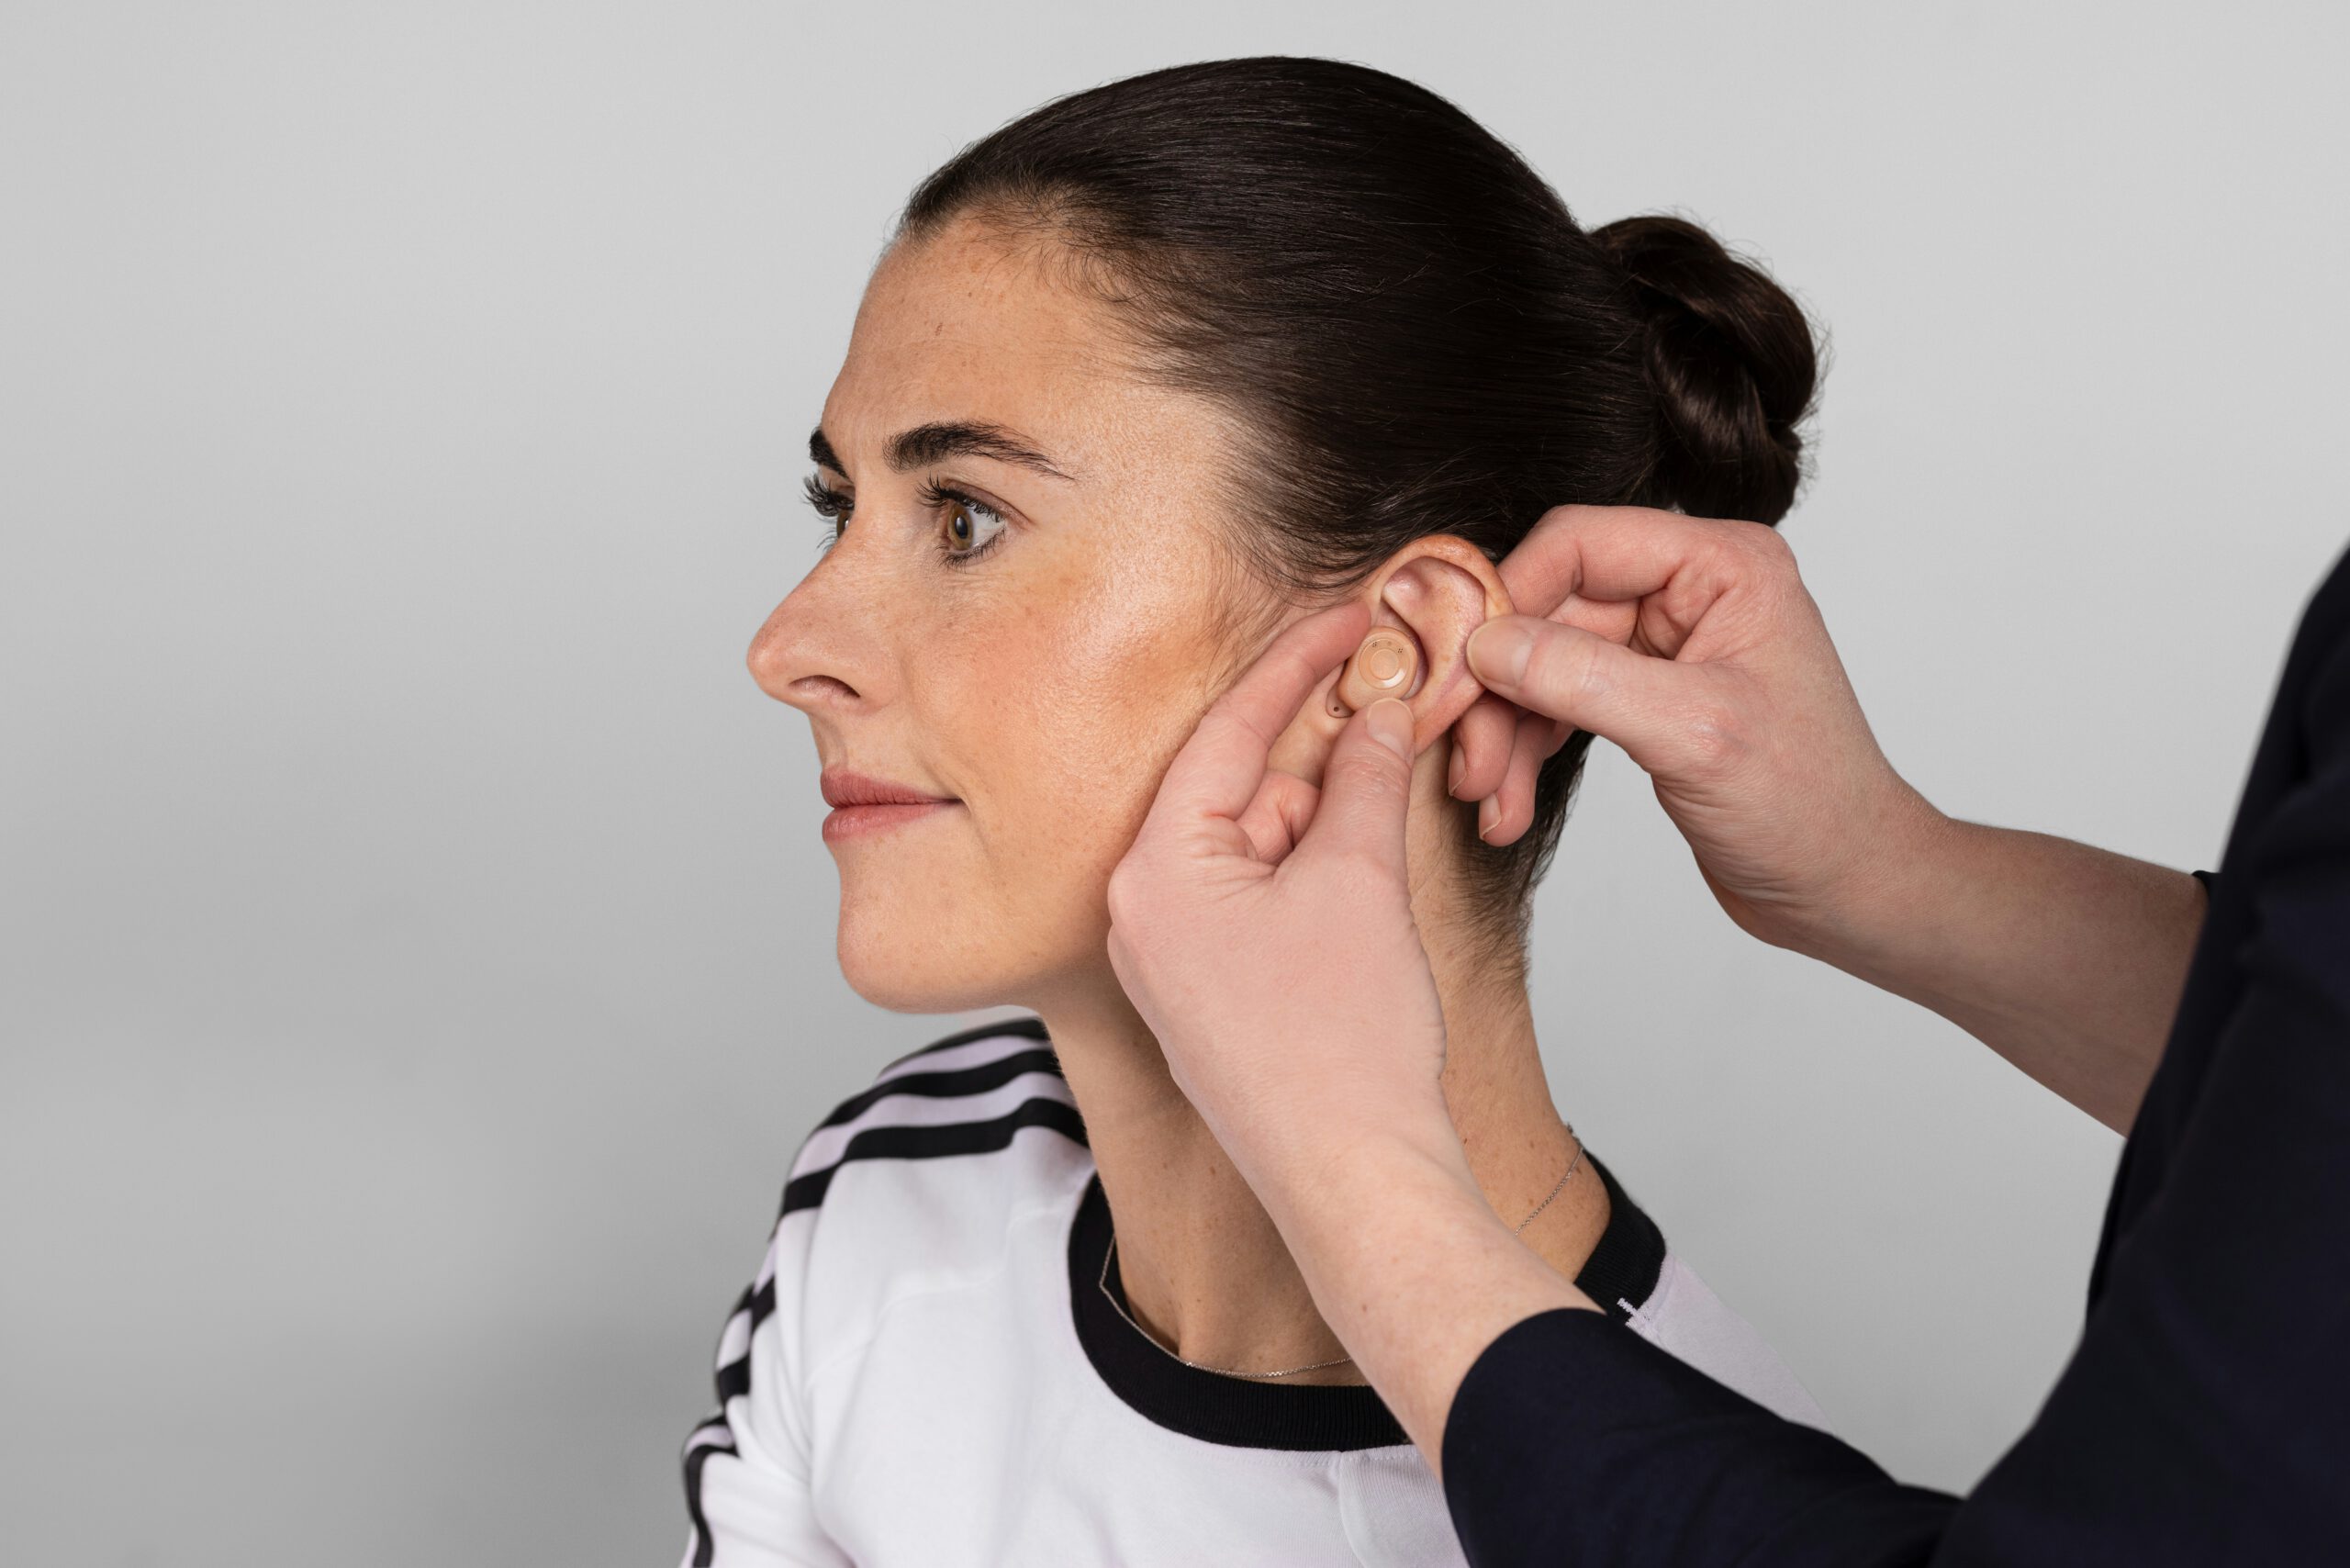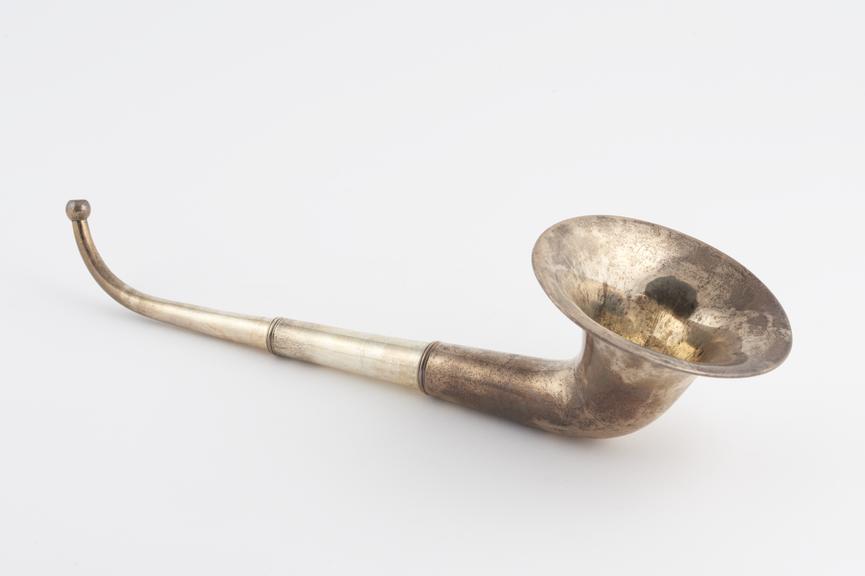
An audiogram is a graph that shows the softest sounds a person can hear at different pitches. Hearing healthcare professionals use it to identify hearing loss, determine which frequencies are affected, and help guide treatment recommendations (American Speech-Language-Hearing Association [ASHA], n.d.).
Understanding the Audiogram
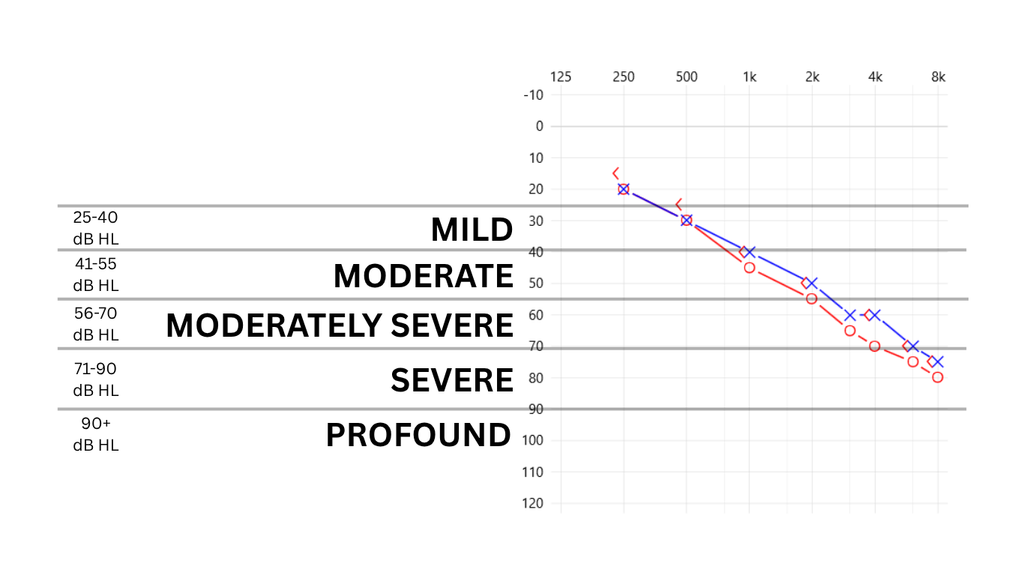
An audiogram has two main axes:
- Horizontal axis (frequency): Measured in hertz (Hz), this represents pitch. Low-pitched sounds appear on the left, while high-pitched sounds appear on the right.
- Vertical axis (hearing level): Measured in decibels hearing level (dB HL), this indicates how loud a sound must be before a person can hear it. The scale typically increases downward, meaning that marks lower on the graph indicate poorer hearing thresholds (National Institute on Deafness and Other Communication Disorders [NIDCD], n.d.).
What Do the Symbols Mean?
On a typical audiogram, a red circle (O) represents the right ear, while a blue cross (X) represents the left ear for air-conduction testing. Other symbols may represent bone-conduction results. Comparing these measurements helps a hearing healthcare professional assess hearing sensitivity and identify possible types of hearing loss (ASHA, n.d.).
How to Interpret the Results
Hearing thresholds around 0–20 dB HL are generally considered within the normal range for adults. Thresholds that fall farther down the graph may indicate different degrees of hearing loss. The overall pattern also matters: some people have difficulty hearing high-pitched sounds, while others experience hearing loss across a wider range of frequencies (NIDCD, n.d.).
An audiogram is only one part of a complete hearing assessment. Speech understanding, symptoms, medical history, and other test results are also important. A qualified hearing healthcare professional can explain what the findings mean for an individual’s communication needs and whether hearing aids or other interventions may be helpful.
Contact us today for a free, no obligation hearing test and consult.
No content on this site, regardless of date, should ever be used as a substitute for direct medical advice from your doctor or other qualified clinician.
References
American Speech-Language-Hearing Association. (n.d.). Guidelines for manual pure-tone threshold audiometry. https://doi.org/10.1044/policy.gl2005-00014
National Institute on Deafness and Other Communication Disorders. (n.d.). What the numbers mean: An epidemiological perspective on hearing. https://www.nidcd.nih.gov/health/statistics/what-numbers-mean-epidemiological-perspective-hearing